MSExcel - Keeping Track of Sales
This task will not have too many instructions, at this point I am hoping that you are starting to figure out the tools in excel and how to use them.
Your task is to input the following data...
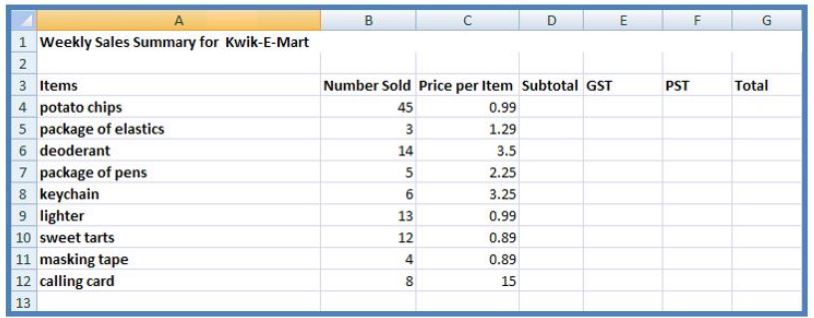
and then format it so that it looks like this....
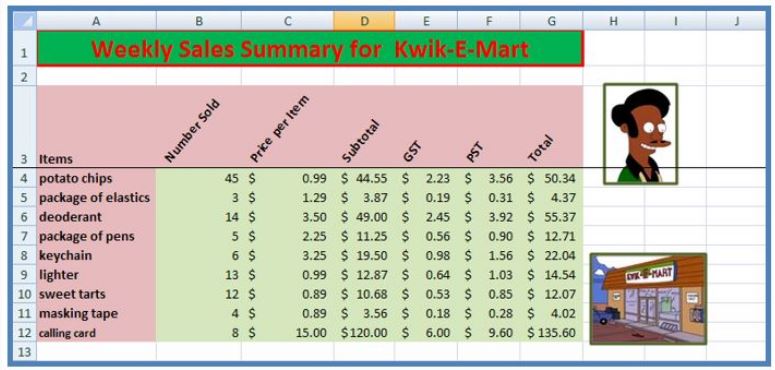
The GST is the subtotal * 0.05 and the PST is subtotal * 0.08
Once you have completed the table you should create a graph that lists the items and the total from each, sort of like this...
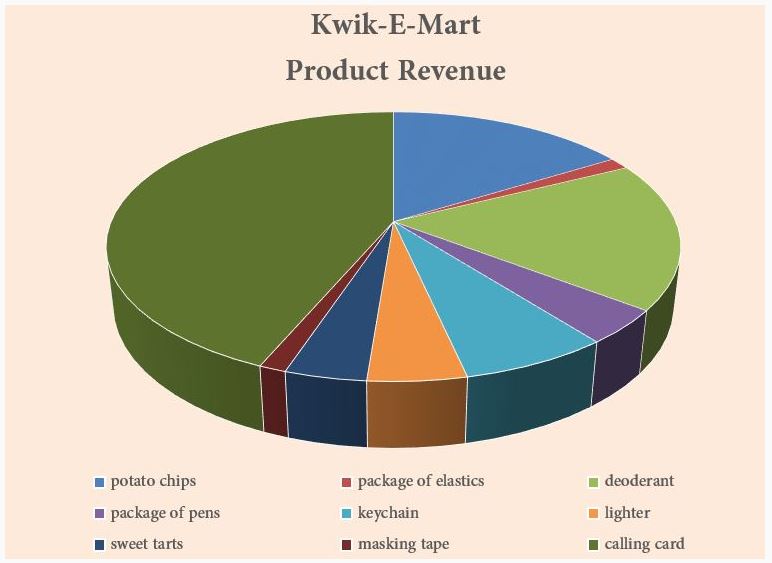
Remember, creating charts can be tricky.
Go back and read the notes and watch the video tutorial on how to do this.
Follow the steps closely.
Also, be ready to play around with the chart a little.
You can right click on different aspects, like the title, in order to change those attributes.